Climate Impacts in the Amazon

Illustrates climate change in three sectors in a humid tropical climate.
Select a sector and explore.
- Climate (8) chevron_right
- Forest & biodiversity (8) chevron_right
- Water (2) chevron_right
Climate Impacts in Bavaria

Illustrates climate change in a federal state of Germany.
Select a sector and explore.
- Climate (28) chevron_right
Climate Impacts in Central Asia

Illustrates climate change in two sectors over multiple climate zones.
Select a sector and explore.
- Climate (17) chevron_right
- Agriculture (14) chevron_right
- Water (4) chevron_right
- Energy (2) chevron_right
- Health (9) chevron_right
Climate Impacts in the Congo River Basin

Illustrates climate change in one sector in a humid tropical climate.
Select a sector and explore.
- Climate (11) chevron_right
- Water (8) chevron_right
Climate Impacts in Ethiopia

Illustrates climate change in four sectors in a humid tropical climate.
Select a sector and explore.
- Climate (9) chevron_right
- Forest & biodiversity (7) chevron_right
- Water (2) chevron_right
- Agriculture (19) chevron_right
Climate Impacts in Europe

Illustrates climate change in one sector over multiple climate zones.
Select a sector and explore.
- Climate (20) chevron_right
- Socioeconomics (4) chevron_right
- Health (9) chevron_right
- Water (10) chevron_right
- Agriculture (8) chevron_right
Climate Impacts in Germany

Illustrates climate change in multiple sectors in a temperate climate.
Select a sector and explore.
- Climate (28) chevron_right
- Agriculture (9) chevron_right
- Forest & biodiversity (3) chevron_right
- Water (12) chevron_right
- Energy (3) chevron_right
- Health (3) chevron_right
- Tourism (3) chevron_right
Climate Impacts in India

Illustrates climate change in two sectors over multiple climate zones.
Select a sector and explore.
- Climate (9) chevron_right
- Agriculture (7) chevron_right
Climate Impacts in Jordan

Illustrates climate change in one sector in a mediterranean climate.
Select a sector and explore.
- Climate (19) chevron_right
Climate Impacts in Peru

Illustrates climate change in two sectors over multiple climate zones.
Select a sector and explore.
- Climate (16) chevron_right
- Agriculture (1) chevron_right
Climate Impacts in the Sahel Region

Illustrates climate change in two sectors in a tropical and desert zone.
Select a sector and explore.
- Climate (7) chevron_right
- Agriculture (56) chevron_right
Climate Impacts in Tanzania

Illustrates climate change in two sectors in a tropical climate.
Select a sector and explore.
- Climate (7) chevron_right
- Agriculture (1) chevron_right
The sector Climate depicts the climatic changes, the other sectors illustrate possible impacts induced by the changing climate. For an overview of the available variables, please select the desired sector and explore the variable previews in their respective countries / regions:
| Amazon | Bavaria | Central Asia | Congo river basin | Ethiopia | Europe | Germany | India | Jordan | Peru | Sahel region | Tanzania | |
|---|---|---|---|---|---|---|---|---|---|---|---|---|
| Temperature | ||||||||||||
| Mean air temperature Mean Near-Surface Air T |
|
|
|

|
|
|
|
|
|
|
|

|
| Minimum air temperature Total Minimum Air T in year/season |
|
|
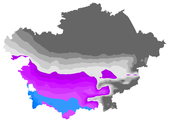
|

|
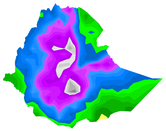
|
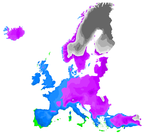
|
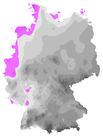
|
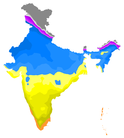
|
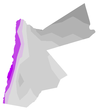
|
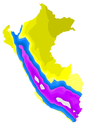
|
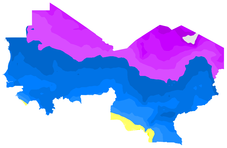
|

|
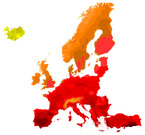
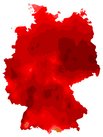
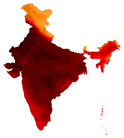
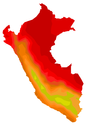
| Maximum air temperature Total Maximum Air T in year/season |
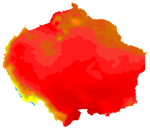
|
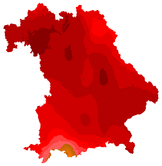
|
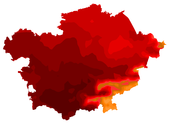
|

|
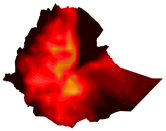
|
|
|
|

|
|
|

|
| Air temperature range Maximum Daily Near-Surface Air T Range |

|
|
|

|
|
|
|
|

|
|
|

|
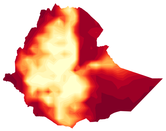
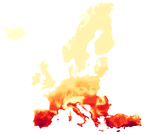
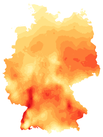
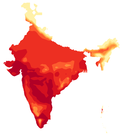
| Hot days Number of hot days |
|
|
|

|
|
|
|
|

|
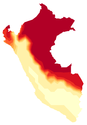
|
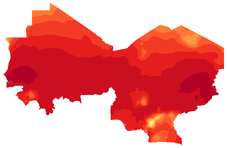
|

|
| Summer days Number of summer days (>=25°C) |
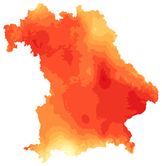
|
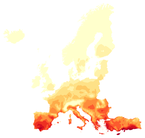
|
|
|
||||||||
| Very hot days Number of very hot days (>=35°C) |
|

|
|
|

|
|
||||||
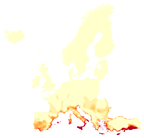
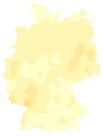
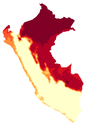
| Tropical nights Number of tropical nights (>=20°C) |
|
|
|
|
|
|||||||
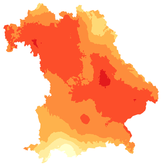
| Continuous hot days Maximum continuous hot days |
|
|
|
|

|
|
||||||
| Frost days Number of frost days |
|
|
|
|

|

|
||||||
| Continuous frost days Maximum continuous frost days |
|
|
|
|

|
|||||||
| Ice days Number of ice days |
|
|
|
|

|
|||||||
| Continuous ice days Maximum continuous ice days |
|
|
|
|
||||||||
| Precipitation | ||||||||||||
| Precipitation Precipitation |
|
|
|

|
|
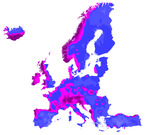
|
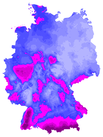
|
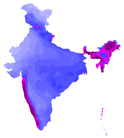
|
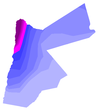
|
|
|

|
| Climatic water balance Climatic water balance (precipitation minus potential evapotranspiration) |

|

|
||||||||||
| Wet days Number of wet days |
|
|

|
|
|
|
|
|

|
|

|
|
| Strong precipition days Number of strong precipition days |
|
|
|
|
||||||||
| Dry days Number of dry days (<= 1mm) |
|
|

|
|
||||||||
| Continuous dry days Maximum continuous dry days |
|

|
|
|||||||||
| Wettest day Wettest day of year / season |
|
|

|
|
|

|
|
|||||
| Snow depth Average snow depth |
|
|
||||||||||
| 10cm snow days Days with at least 10cm snow depth |
|
|
||||||||||
| 30cm snow days Days with at least 30cm snow depth |
|
|
||||||||||
| Maximum Precipitation Maximum Precipitation |

|
|||||||||||
| Consecutive dry days index Yearly consecutive dry days |

|
|||||||||||
| Further | ||||||||||||
| Relative humidity Near-Surface Humidity |
|
|
|

|
|
|
|

|
||||
| Global radiation Global Radiation Energy |
|

|
|

|
|
|

|

|
||||
| Wind | ||||||||||||
| Mean wind speed Mean wind speed per year / season |
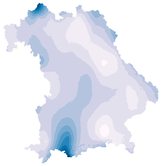
|
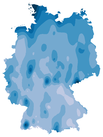
|
||||||||||
| Windy days Windy days (mean wind >= 25 km/h) |
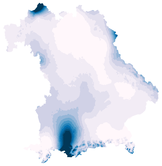
|
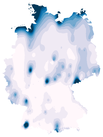
|
||||||||||
| Maximum wind speed Maximum daily mean wind speed in a year / season |
|
|
||||||||||
| Precipitation Cordex | ||||||||||||
| Precipitation 03-hr Max. 3 hourly precipitation |
|
|||||||||||
| Precipitation 06-hr Max. 6 hourly precipitation |

|
|||||||||||
| Precipitation 09-hr Max. 9 hourly precipitation |

|
|||||||||||
| Precipitation 12-hr Max. 12 hourly precipitation |

|
|||||||||||
| Precipitation 24-hr Precipitation 24 hourly |

|
| Central Asia | Ethiopia | Europe | Germany | India | Peru | Sahel region | Tanzania | ||||
|---|---|---|---|---|---|---|---|---|---|---|---|
| Precipitation | |||||||||||
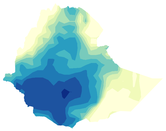
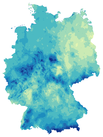
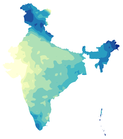
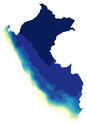
| Consecutive dry days index Yearly consecutive dry days |
|
|
|
|
|
|

|
||||
| Summer wheat | |||||||||||
| Yield (Irrigated) Crop Yield (Irr): Summer Wheat |

|
|
|||||||||
| Yield (Non-irrigated) Crop Yield (Noirr): Summer Wheat |

|
|
|||||||||
| Growing degree days GDD: Summer Wheat |
|
||||||||||
| Global radiation Radiation: Summer Wheat |
|
||||||||||
| Humidity Humidity: Summer Wheat |
|
||||||||||
| Winter wheat | |||||||||||
| Yield (Irrigated) Crop Yield (Irr): Winter Wheat |

|
|
|||||||||
| Yield (Non-irrigated) Crop Yield (Noirr): Winter Wheat |

|
|
|||||||||
| Growing degree days GDD: Winter Wheat |
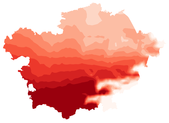
|
||||||||||
| Global radiation Radiation: Winter Wheat |
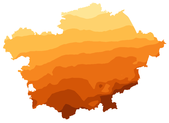
|
||||||||||
| Humidity Humidity: Winter Wheat |
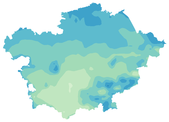
|
||||||||||
| Cotton | |||||||||||
| Growing degree days GDD: Cotton |
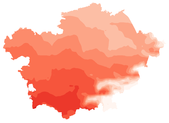
|
||||||||||
| Global radiation Radiation: Cotton |
|
||||||||||
| Humidity Humidity: Cotton |
|
||||||||||
| Relative Humidity for | |||||||||||
| Teff Humidity: Teff |
|
||||||||||
| Maize Humidity: Maize |
|
||||||||||
| Wheat Humidity: Wheat |
|
||||||||||
| Sorghum Humidity: Sorghum |
|
||||||||||
| Millet Humidity: Millet |
|
||||||||||
| Coffea Arabica Humidity: Coffea Arabica |
|
||||||||||
| Kharif rice Humidity: Kharif rice |
|
||||||||||
| Rabi wheat Humidity: Rabi wheat |
|
||||||||||
| Global Radiation for | |||||||||||
| Teff Radiation: Teff |
|
||||||||||
| Maize Radiation: Maize |
|
||||||||||
| Wheat Radiation: Wheat |
|
||||||||||
| Sorghum Radiation: Sorghum |
|
||||||||||
| Millet Radiation: Millet |
|
||||||||||
| Coffea Arabica Radiation: Coffea Arabica |
|
||||||||||
| Kharif rice Radiation: Kharif rice |
|
||||||||||
| Rabi wheat Radiation: Rabi wheat |
|
||||||||||
| Growing Degree Days for | |||||||||||
| Teff GDD: Teff |
|
||||||||||
| Maize GDD: Maize |
|
||||||||||
| Wheat GDD: Wheat |
|
||||||||||
| Sorghum GDD: Sorghum |
|
||||||||||
| Millet GDD: Millet |
|
||||||||||
| Coffea Arabica GDD: Coffea Arabica |
|
||||||||||
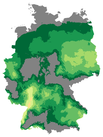
| Wine (Huglin index) Huglin index for wine groth |
|
||||||||||
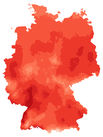
| Summer Wheat GDD: Summer Wheat |
|
||||||||||
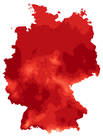
| Winter Wheat GDD: Winter Wheat |
|
||||||||||
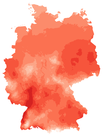
| Maize GDD: Maize |
|
||||||||||
| Canola GDD: Canola |
|
||||||||||
| Kharif rice GDD: Kharif rice |
|
||||||||||
| Rabi wheat GDD: Rabi wheat |
|
||||||||||
| Maize | |||||||||||
| Yield (Irrigated) Crop Yield (Irr): Maize |
|
||||||||||
| Yield (Non-irrigated) Crop Yield (Noirr): Maize |
|
||||||||||
| Soy | |||||||||||
| Yield (Irrigated) Crop Yield (Irr): Soy |
|
||||||||||
| Yield (Non-irrigated) Crop Yield (Noirr): Soy |
|
||||||||||
| Precipitation for | |||||||||||
| Canola Precipitation: Canola |
|
||||||||||
| Yields | |||||||||||
| Silage maize yield Silage maize yield (ABSOLUT district model) |

|
||||||||||
| Winter wheat yield Winter wheat yield (ABSOLUT district model) |

|
| Amazon | Ethiopia | Germany | |||||||||
|---|---|---|---|---|---|---|---|---|---|---|---|
| No CO₂ fertilization | |||||||||||
| Aboveground biomass Aboveground biomass |
|
|
|||||||||
| Evapotranspiration Evapotranspiration |
|
|
|||||||||
| Net primary production Net primary production |
|
|
|||||||||
| With CO₂ fertilization | |||||||||||
| Aboveground biomass Aboveground biomass |
|
|
|||||||||
| Evapotranspiration Evapotranspiration |
|
|
|||||||||
| Net primary production net primary production |
|
|
|||||||||
| Climatic drivers | |||||||||||
| Potential evapotranspiration Potential evapotranspiration |
|
|
|||||||||
| Dry season length Dry season length (precipitation < 100 mm) |

|
||||||||||
| Fire danger | |||||||||||
| Forest fire risk index Annual mean M68 forest fire danger index |
|
||||||||||
| High fire danger days Days with high fire danger (M68 level 4-5) |
|
||||||||||
| Very high fire danger days Days with very high fire danger (M68 level 5) |
|
| Amazon | Central Asia | Congo river basin | Ethiopia | Europe | Germany | ||||||
|---|---|---|---|---|---|---|---|---|---|---|---|
| Total runoff Total water runoff |
|
|
|
||||||||
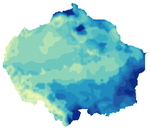
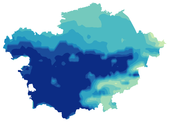
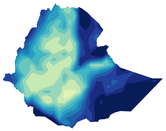
| Potential evapotranspiration Potential evapotranspiration |
|
|
|
||||||||
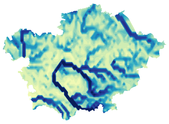
| Total evapotranspiration Total evapotranspiration |
|
||||||||||
| Snow water equivalent Snow water equivalent |
|
||||||||||
| Groundwater recharge Yearly Groundwater recharge |
|
||||||||||
| Subsurface runoff Yearly water subsurface runoff |
|
||||||||||
| Surface runoff Yearly water surface runoff |
|
||||||||||
| Water yield Yearly water yield |
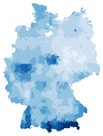
|
||||||||||
| Mean discharge Mean water discharge |
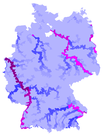
|
||||||||||
| Atmospheric and Climatic | |||||||||||
| Precipitation Yearly Precipitation |

|
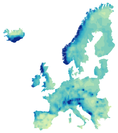
|
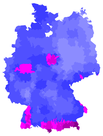
|
||||||||
| Actual evapotranspiration Actual evapotranspiration |

|
|
|
||||||||
| Potential evapotranspiration Potential evapotranspiration |

|
|
|
||||||||
| Water yield Yearly water yield |

|
|
|||||||||
| Climatic water balance Climatic water balance |
|
|
|||||||||
| Soil and Groundwater | |||||||||||
| Groundwater recharge Yearly Groundwater recharge |

|
|
|||||||||
| Subsurface runoff Yearly water subsurface runoff |

|
|
|||||||||
| Average water baseflow Average water baseflow |

|
|
|||||||||
| River Basins | |||||||||||
| Surface runoff Yearly water surface runoff |

|
|
|||||||||
| Maximum discharge Maximum water discharge |
|
|
|||||||||
| Minimum discharge Minimum water discharge |
|
|
| Central Asia | Germany | ||||||||||
|---|---|---|---|---|---|---|---|---|---|---|---|
| Solar energy | |||||||||||
| Photovoltaic yield Photovoltaic yield with temperature correction |

|

|
|||||||||
| PV heat loss Photovoltaic yield loss due to heat |

|

|
|||||||||
| Wind | |||||||||||
| Mean wind speed Mean wind speed per year / season |
|
| Central Asia | Europe | Germany | |||||||||
|---|---|---|---|---|---|---|---|---|---|---|---|
| Heat stress | |||||||||||
| Mean wet-bulb temperature Mean Wet-bulb Globe Temperature |
|
|
|||||||||
| Max wet-bulb temperature Maximum Wet-bulb Globe Temperature |
|
|
|||||||||
| Min wet-bulb temperature Minimum Wet-bulb Globe Temperature |
|
|
|||||||||
| Heat stress during hottest hours | |||||||||||
| Days with strong heat risk Days with strong heat risk (WBGT daily maximum above 29 °C) |
|
|
|||||||||
| Days with extreme heat risk Days with extreme heat risk (WBGT daily maximum above 31 °C) |
|
|
|||||||||
| Days with life threathening heat Days with life threathening heat (WBGT daily maximum above 33 °C) |
|
|
|||||||||
| Whole day heat stress | |||||||||||
| Days with strong heat risk Days with strong heat risk (WBGT daily mean above 29 °C) |
|
|
|||||||||
| Days with extreme heat risk Days with extreme heat risk (WBGT daily mean above 31 °C) |
|
|
|||||||||
| Days with life threathening heat Days with life threathening heat (WBGT daily mean above 33 °C) |
|

|
|||||||||
| Day heat risks | |||||||||||
| Hot days Number of hot days (>=30°C) |
|
||||||||||
| Very hot days Number of very hot days (>=35°C) |
|
||||||||||
| Night heat risks | |||||||||||
| Tropical nights Number of tropical nights (>=20°C) |
|
| Germany | |||||||||||
|---|---|---|---|---|---|---|---|---|---|---|---|
| Summer tourism | |||||||||||
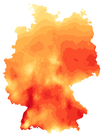
| Summer days Number of summer days (>=25°C) |
|
||||||||||
| Winter tourism | |||||||||||
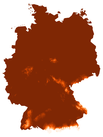
| 10cm snow days Days with at least 10cm snow depth |
|
||||||||||
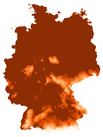
| 30cm snow days Days with at least 30cm snow depth |
|
| Europe | |||||||||||
|---|---|---|---|---|---|---|---|---|---|---|---|
| Labor Productivity | |||||||||||
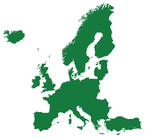
| Light intensity work productivity Daily Mean Labor Productivity |
|
||||||||||
| Medium intensity work productivity Daily Mean Labor Productivity |
|
||||||||||
| High intensity work productivity Daily Mean Labor Productivity |
|
||||||||||
| Very high intensity work productivity Daily Mean Labor Productivity |
|
Welcome to ClimateImpactsOnline data visualization portal, which offers maps, diagrams and tabular data supplemented by additional information texts and data download functionality. The portal is available in the languages of the displayed regions. The visualized data includes observations and climate model simulations for the past and for future scenarios (tab Data). How this page is organised is shown in the tab This page; how the map view is used is explained there under Usage.
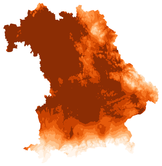
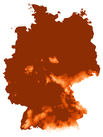
World map. The map at the top shows all regions of the portal. Each of the small coloured hexagons stands for one variable, its colour for the sector (the same colours as in the list of sectors below). So you see at a glance how many variables a region offers in which sectors; the mouse pointer pushes the hexagons aside. A click on a region opens a window with a short description and its sectors with the number of variables; a click on a sector leads to the map of the region.
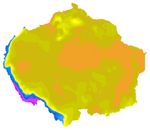
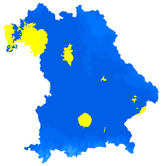
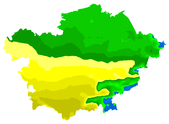
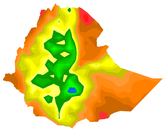
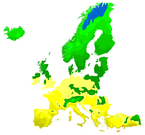
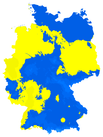
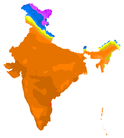
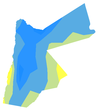
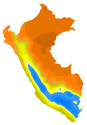
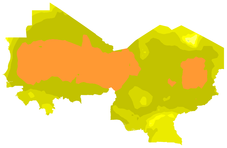
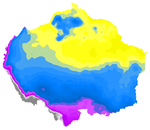
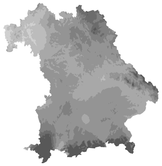
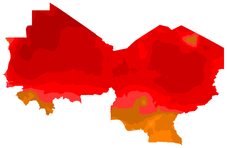
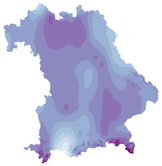
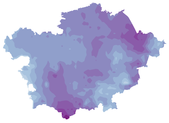
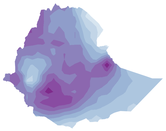
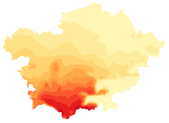
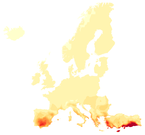
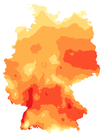
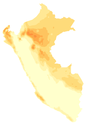
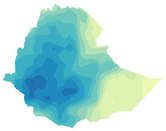
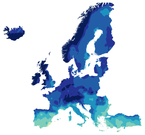
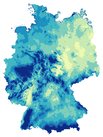
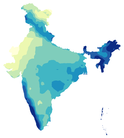
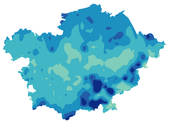
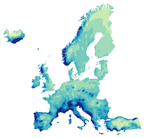
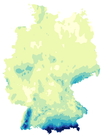
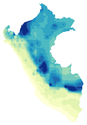
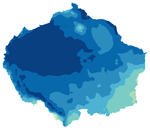
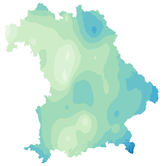
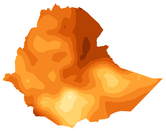
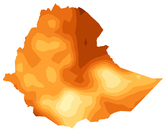
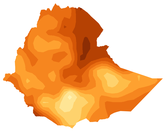
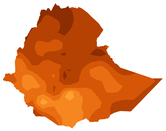
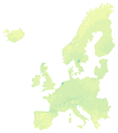
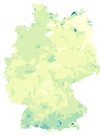
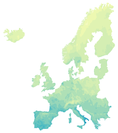
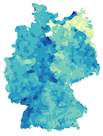
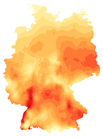
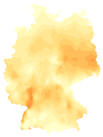
Sector overview. Below the map the sectors are listed with the number of regions that offer them. A click opens an overview: one row per variable, one column per region, with small preview maps. So you can compare which variables exist where; a click on a preview opens the map of that variable in that region directly.
Header and footer. At the top right you choose the language and find „Old design“, the previous version of the portal. At the bottom you find the news, the imprint, data privacy, contact and the newsletter.
How maps, time line, settings, diagrams and tables are used on the region pages is explained there under Usage in the top bar.
Observations and simulations. For the past the portal shows observations: for Germany and Bavaria values interpolated from the stations of the German Weather Service, for the other regions the observation-based global data set W5E5. They are the best-founded basis. Next to them are historical simulations: climate models recompute the past, and the comparison with the observations shows how well they reproduce the climate of a region. The future projections continue these model runs under different scenarios. The simulations are adjusted to the observations (bias adjustment, ISIMIP3BASD) to reduce systematic model errors.
Uncertainties. Projections are not forecasts. They depend on the scenario, on the climate models and, for climate impacts, also on the impact models; single models and methods have known weaknesses, especially for precipitation and extremes. The portal therefore shows means over 10 or 30 years and the spread of the model ensemble (10th to 90th percentile), not the value of a single year.
Scenarios. Most regions use the scenarios of the latest model generation (CMIP6), which combine socio-economic pathways with emissions: SSP1-2.6 (sustainable development, strong climate protection), SSP3-7.0 (regional rivalry, high emissions) and SSP5-8.5 (fossil-fuelled development, very high emissions). For Germany and Bavaria the data are based on the regional model ensemble EURO-CORDEX of the previous generation (CMIP5) with the scenarios RCP2.6 (strong climate protection, about 2 °C) and RCP8.5 (very high emissions).
Data sources.
- Global climate models from ISIMIP (Inter-Sectoral Impact Model Intercomparison Project, coordinated by PIK), CMIP6, for most regions.
- Regional climate models from CORDEX (Coordinated Regional Climate Downscaling Experiment): for Germany and Bavaria the EURO-CORDEX ensemble of combinations of global and regional models (17 runs for RCP8.5, 7 for RCP2.6), for Jordan in addition CORDEX precipitation at high temporal resolution (RCP8.5).
- Further climate data sets for single regions, e.g. RAIN4PE (precipitation) in Peru.
- Climate impacts from ISIMIP: global hydrological models (water) and crop and vegetation models (agriculture) of several research groups.
- PIK models: the eco-hydrological model SWIM (water in Germany, Europe and the Congo basin), the vegetation model LPJmL (forests and biodiversity in the Amazon and Ethiopia) and the statistical yield model ABSOLUT (silage maize and winter wheat per district in Germany).
- Derived indicators: many variables are calculated by KFO itself from the daily climate data, e.g. hot days and frost days, growing degree days, climatic water balance or photovoltaic yield.
Which data and models are used for a region in detail is described there under data info.
Climate Impacts Online is for everyone who wants to know how the climate and its impacts may develop in a region – no background in climate modelling needed.
- School and university students explore climate change in their own or a distant region, compare scenarios and periods and use maps and diagrams for presentations and projects.
- Teachers find clear maps, diagrams and tables for lessons in geography, biology, physics or politics, for very different regions of the world.
- Planners of adaptation measures in municipalities, districts, regional and state planning, water management, forestry and agricultural administrations get a first assessment down to the district level; the data can be downloaded.
- Professions that depend on weather and climate: agriculture, horticulture, wine and fruit growing (e.g. frost days, growing degree days, Huglin index, dry days, yields), forestry (forests and biodiversity), energy (photovoltaic yield, wind), tourism (snow days), health and care (hot days, tropical nights, heat stress), construction and urban planning (heavy precipitation, heat).
- Media, policy and administration use the portal for a quick overview and for graphics on regional climate impacts.
- Development and international cooperation finds data for regions in Africa, Asia and South America, in the languages of these regions.
- Anyone interested sees what climate change may mean for their home town, their garden or their holiday destination.
The maps show means over 10 or 30 years and the spread of a model ensemble, not a weather forecast. For planning, read the data info of the region as well.